
Monitoring network traffic is vital for troubleshooting, capacity planning, and identifying bottlenecks. MikroTik’s powerful, built-in Graphing tool allows you to visually track bandwidth usage over time for any interface (WAN, LAN, Bridge, or VLAN) without needing external software.
1. Configure Graphing Settings
First, you need to access the tool and set the data retention period.
-
In WinBox, navigate to Tools > Graphing.

-
Go to the Settings tab.
-
Set the Store Time to define how long the historical data will be saved.
-
The video sets this to
5m(5 minutes) for a more frequent look at recent activity, but you can set this to days or hours.
-
-
Click Apply and OK.
2. Add Interfaces to Monitor
Next, you need to specify which network interfaces you want the router to monitor and generate graphs for.
-
While in Tools > Graphing, go to the Interface tab.
-
Click the
+button to add a new rule.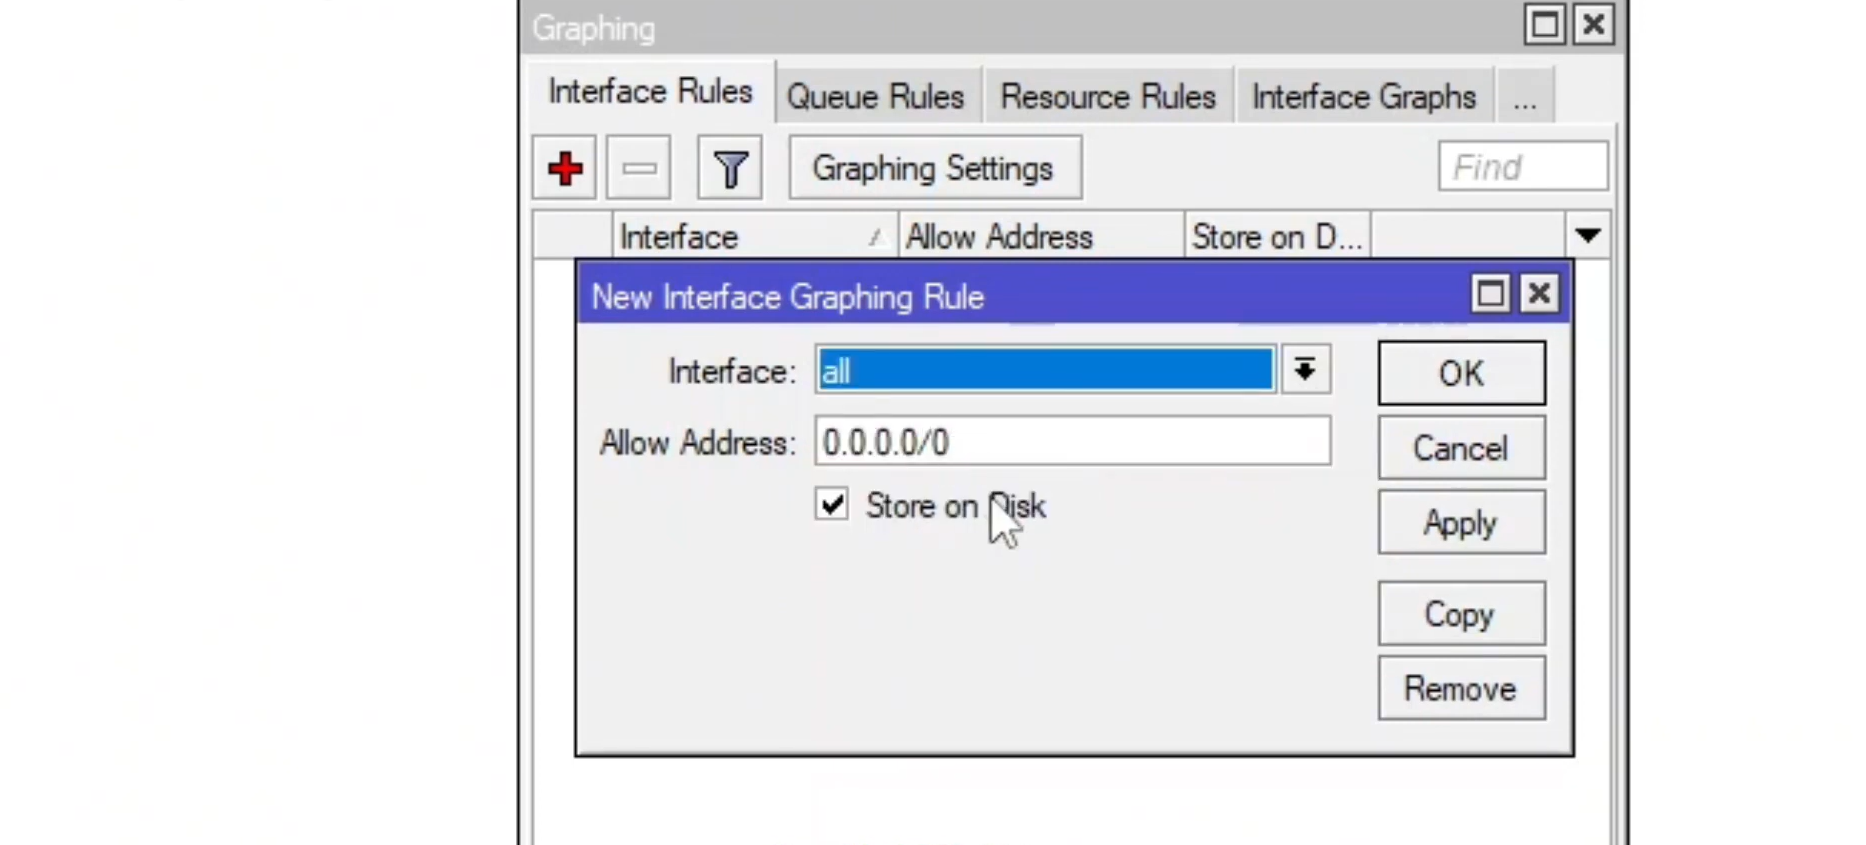
-
In the new window:
-
Interface: Select the interface you want to monitor (e.g.,
ether1-gateway,bridge-lan, or a specific VLAN).-
Tip: You can select the
alloption to generate graphs for every active interface, as shown in the video.
-
-
Allow From: (Optional) You can limit which IP addresses are allowed to view the graphs. Leaving this blank (or setting it to
0.0.0.0/0) allows access from anywhere on the network. -
Store On Disk: Ensure this is checked to save the data.

-
-
Click Apply and OK.
The router will immediately begin collecting data for the selected interface(s).
3. View the Traffic Graphs
The traffic graphs are accessed directly through a web browser using the router’s IP address and the special /graphs path.
-
Determine the IP address of your MikroTik router (e.g.,
192.168.1.59).
-
Open any web browser and enter the following URL, replacing the IP address with your router’s IP:
http://[MikroTik-IP-Address]/graphs(Example:
http://192.168.12.159/graphs)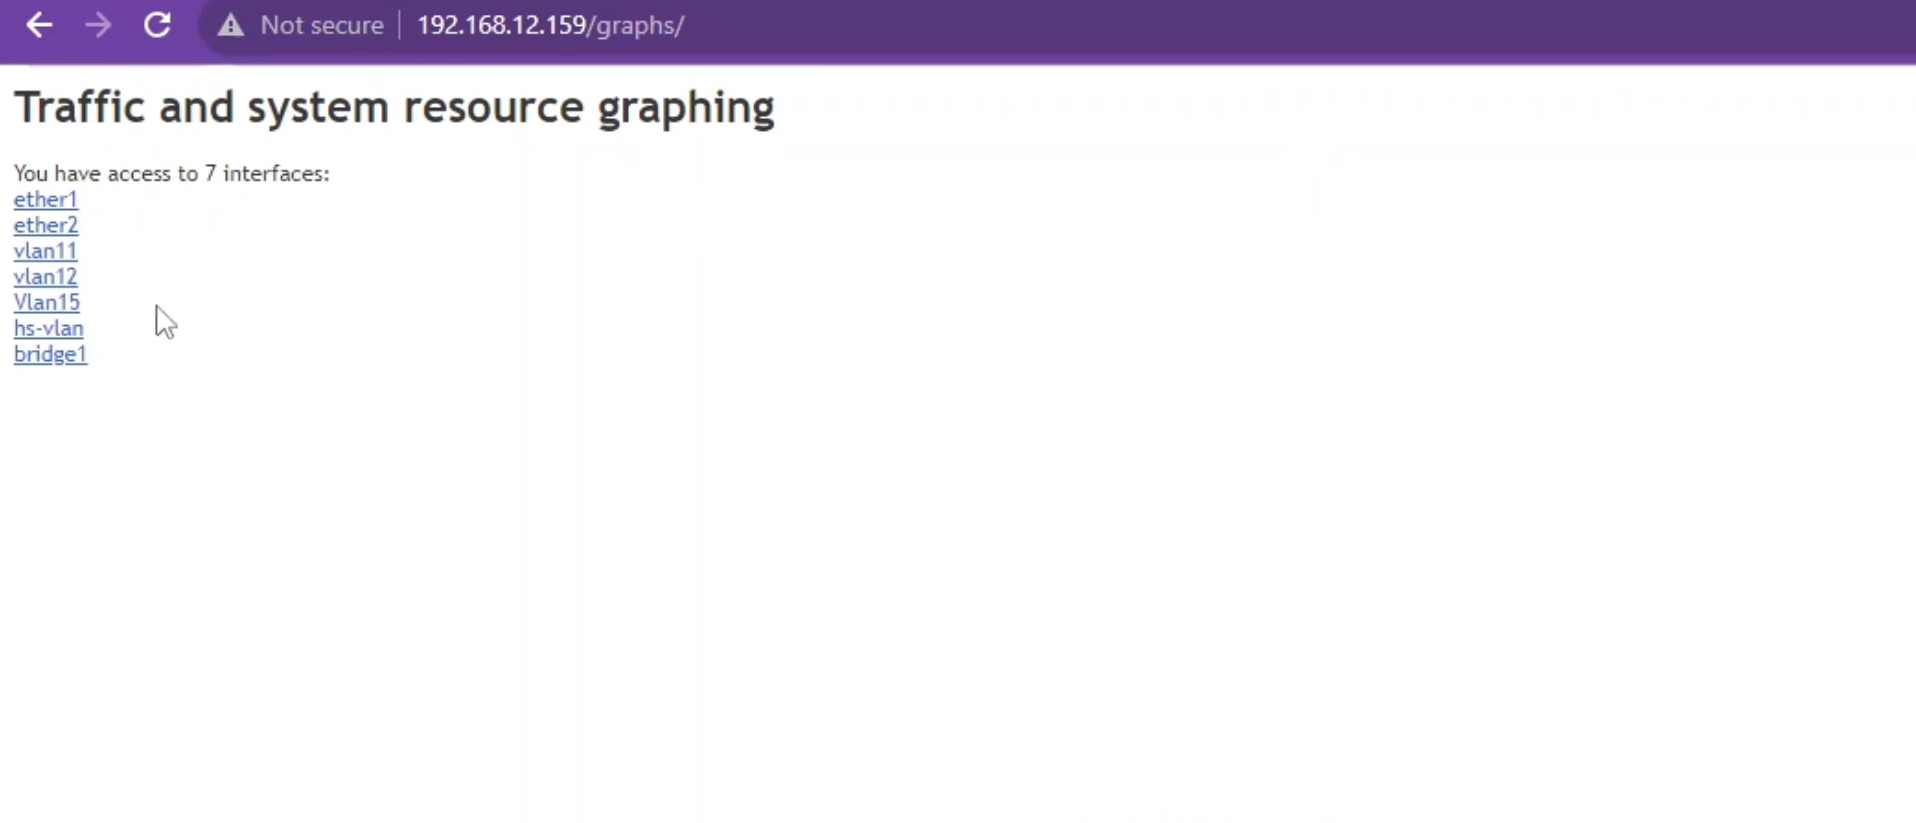
-
The browser will display a list of all interfaces you configured for monitoring. Click on any interface (e.g.,
ether1) to see its traffic graph.
The graph displays both Received (Download) and Sent (Upload) traffic over the configured historical time period, giving you a clear visual representation of bandwidth usage.